
Food waste statistics 2026: the US numbers, with their data years
Food waste statistics for 2026 are mostly older data than the year suggests. The newest US national figures are ReFED's for 2024 and EPA's for 2019, and the most-quoted number of all, "30 to 40 percent", goes back to a USDA estimate built on 2010 data. That doesn't make them wrong. It does mean every figure below comes with the year it describes, not the year it was published.
The headline numbers, as of September 2026:
- 29% of the 240 million tons in the US food supply went unsold or uneaten in 2024 (ReFED).
- 66.2 million tons of food were wasted by US households, restaurants and food retail in 2019, plus 40.1 million tons in manufacturing (EPA).
- $728 per person a year, or $2,913 for a household of four, is what consumers pay for food they don't eat (EPA, 2025 report).
- 40% of the wasted food EPA counted in 2019 came from households, 40% from food service and 20% from retail.
- 1.05 billion tonnes of food were wasted worldwide in 2022, 60% of it in households (UNEP).
Every major figure, with what it measures
Most arguments about food waste numbers are two people quoting different measurements. This is the whole set in one place.
| Figure | What it measures | Data year | Source |
|---|---|---|---|
| 29% of the 240M-ton food supply | US surplus: food unsold or uneaten, farm to fork | 2024 | ReFED |
| 25%, 60M tons | The part of that surplus ReFED counts as waste: landfill, combustion, sewer, compost, digestion, dumping, land spreading or left unharvested | 2024 | ReFED |
| $381 billion, of which $325 billion waste | Value of that surplus | 2024 | ReFED |
| 66.2M tons | Wasted food from retail, food service and households | 2019 | EPA 2019 Wasted Food Report |
| 40.1M tons | Wasted food from manufacturing and processing | 2019 | EPA |
| 349 lb per person | Food waste leaving the human food supply chain, all pathways | 2019 | EPA 2030 goal |
| 256 lb per person | Edible food bought by consumers and not eaten | 2019 to 2023 | EPA cost of food waste report |
| $728 per person, $2,913 per household of four | What that uneaten food cost | 2019 to 2023 | EPA cost report |
| 31%, 133 billion lb, $161.6 billion | Food supply uneaten at retail and consumer level | 2010 | USDA ERS |
| 30 to 40% | Share of US food that goes uneaten | Not stated | FDA |
| 1.05 billion tonnes, 132 kg per person | Global food waste in households, food service and retail | 2022 | UNEP Food Waste Index 2024 |
| 13.3% | Global food lost between harvest and retail | 2023 | FAO |
If you need one figure to quote for the US, ReFED's 29% for 2024 is the most recent whole-supply-chain estimate. If you need a government figure, EPA's 66.2 million tons for 2019 is the latest national one, and EPA has not published a newer national year.
How much food is wasted in the US
Somewhere between a quarter and 40% of the food supply, depending on who is counting and what they count.
EPA's 2019 report is the most detailed government picture. It found 66.2 million tons of wasted food across food retail, food service and homes, and another 40.1 million tons in food manufacturing and processing. Most of the first group, 59.8%, went to landfill.
ReFED, a nonprofit that tracks food waste across the whole chain including farms, puts 2024 surplus at 29% of the 240 million tons in the US food supply. Of that, 60 million tons, or 25% of all food, went to what it counts as waste destinations: landfill, combustion, sewer, composting, anaerobic digestion, dumping, spreading on land, or left unharvested. Its wider surplus figure also includes food that was donated, fed to animals or turned into other products. It values the surplus at $381 billion, $325 billion of it waste, and describes it as almost 114 billion meals' worth of food.
The "30 to 40 percent" line appears on FDA's consumer page on cutting food waste, which doesn't give a data year. It traces back to USDA's Economic Research Service, which estimated that 31% of the food supply at the retail and consumer levels, 133 billion pounds worth $161.6 billion, went uneaten in 2010. There's no newer ERS estimate, and 2010 became the baseline for the national 2030 goal, which is why it's still everywhere.
Why the estimates disagree
Three reasons, and once you see them the numbers stop contradicting each other.
Scope. ReFED counts farms and manufacturing. EPA's 66.2 million tons doesn't include either, and reports manufacturing separately. USDA's 2010 figure covers only retail and consumers.
Definitions. "Surplus" (ReFED) includes food that was donated or fed to animals. "Waste" doesn't, though ReFED's waste does include composting. Some figures include inedible parts such as bones and peel, and some count only food that could have been eaten.
Method changes. EPA changed its method in 2018 and widened what it counts, and says its estimates rose because of that wider scope. EPA figures from before 2018 can't be compared with later ones. UNEP says the same of its own global series: the rise from its 2019 estimate to its 2022 estimate is not believed to be a real increase.
How much food does one person waste?
About 250 to 350 pounds a year, depending on whether inedible parts count.
| Per-person figure | Includes | Data | Source |
|---|---|---|---|
| 349 lb a year | All food waste leaving the supply chain, including inedible parts | 2019 | EPA |
| 340 lb a year (422 g a day) | Food wasted by consumers | NHANES 2007 to 2014 | Conrad et al., PLOS ONE |
| 256 lb a year | Edible food bought by consumers and not eaten | 2019 to 2023 | EPA |
| 161 lb a year (73 kg) | US household food waste only | 2019 (EPA data) | UNEP |
The 340 lb figure is our conversion of the paper's 422 grams per person per day. The same paper found that wasted food made up 30% of daily calories available for consumption.
The last row is the one to use if you're comparing your own household with the average, because it leaves out restaurants and stores. UNEP's US figure is built from EPA's 2019 data rather than a separate measurement.
What food waste costs a household
EPA's April 2025 report puts the cost at $728 per person a year, $14 a week. Scaled to a household of four, that's $2,913 a year or $56 a week, about 11% of what a household spends on food at home and away from home.
You'll often see "$1,500 a year for a family of four" instead. EPA's report addresses it directly: that figure is based on a USDA analysis of 2010 prices, and the prices of many food categories have risen by more than 50% since. It's out of date, not made up.
EPA also flags that its own estimate is on the low side, because it prices restaurant waste at grocery prices.
Our food waste calculator runs the same arithmetic on your own grocery spend, which is a better number to act on than any national average.
Where US food waste happens
EPA's 2019 split for the 66.2 million tons it counted in retail, food service and homes:
| Sector | Wasted food, 2019 | Share | What happened to most of it |
|---|---|---|---|
| Households | 26.5M tons | 40% | 66.2% landfilled, 15.1% combusted, 15.0% down the drain, 3.7% composted |
| Food service (restaurants, schools, hospitals, offices) | 26.7M tons | 40% | 72% landfilled, 17% combusted, 8% composted |
| Food retail (supermarkets, supercenters, wholesale) | 13.0M tons | 20% | 41.1% donated, 20.9% landfilled, 14.6% composted, 11.1% animal feed |
| Manufacturing and processing (counted separately) | 40.1M tons | 42.6% anaerobic digestion |
Two things stand out. Homes and restaurants produce the same tonnage, but homes compost almost none of it. And retail, which gets most of the public blame, is the smallest of the three and the only sector that donates a large share.
Is food waste going down?
Not measurably, at the national level. EPA's figure went from 328 pounds per person in 2016, the baseline year, to 349 pounds in 2019, an increase of 6%. The 2030 goal is 164 pounds, half the baseline.
EPA's most recent national data year is still 2019, so there's no official US figure after the pandemic. ReFED's annual estimates are the only recent series, and they measure a different, wider thing.
Food waste and climate
On EPA's methane page, updated March 2026, an estimated 58% of the methane that escapes from US municipal landfills comes from landfilled food waste. EPA's 2030 goal page adds that more than 85% of the greenhouse gas emissions from landfilled food waste come from before it's thrown away: growing, transporting, processing and distributing it.
Globally, UNEP estimates that food loss and waste together generate 8 to 10% of greenhouse gas emissions.
Date labels and food waste
FDA estimates that confusion over date labeling accounts for 20% of consumer food waste. FDA doesn't cite the study behind that figure on the page, so treat it as an estimate rather than a measurement.
Except for infant formula, dates on US food aren't required by federal law, and "Best if Used By" is about quality, not safety. We've set out what USDA and FDA say about each label in best before vs use by vs sell by. Writing the dates somewhere you'll see them, like an expiration date tracker, is the practical side of the same problem.
Global food waste statistics
UNEP's Food Waste Index Report 2024 is the global reference. For 2022 it estimates:
| Sector | Per person per year | Total |
|---|---|---|
| Households | 79 kg (174 lb) | 631 million tonnes |
| Food service | 36 kg (79 lb) | 290 million tonnes |
| Retail | 17 kg (37 lb) | 131 million tonnes |
| Total | 132 kg (291 lb) | 1.05 billion tonnes |
That's up to 19% of food that reaches the consumption stage, according to UNEP. No newer edition has been published.
Food loss, before food reaches shops, is tracked separately by FAO: 13.3% of food was lost between harvest and retail in 2023, with Northern America and Europe the lowest region at 10.0%.
The "one third of all food" line you'll still see is a 2011 FAO estimate, roughly 1.3 billion tonnes, that combined loss and waste. It isn't a current figure, and it isn't directly comparable with either of the two above.
Food loss vs food waste
The distinction matters when you compare figures.
- Food loss happens before food reaches a shop: on farms, in storage, in transport and processing. FAO measures it.
- Food waste happens in shops, restaurants and homes. UNEP and EPA measure it.
- Surplus is ReFED's wider term: all food that goes unsold or uneaten, including what's donated or fed to animals.
Measure your own household
National averages tell you the scale. Your own number tells you what to change.
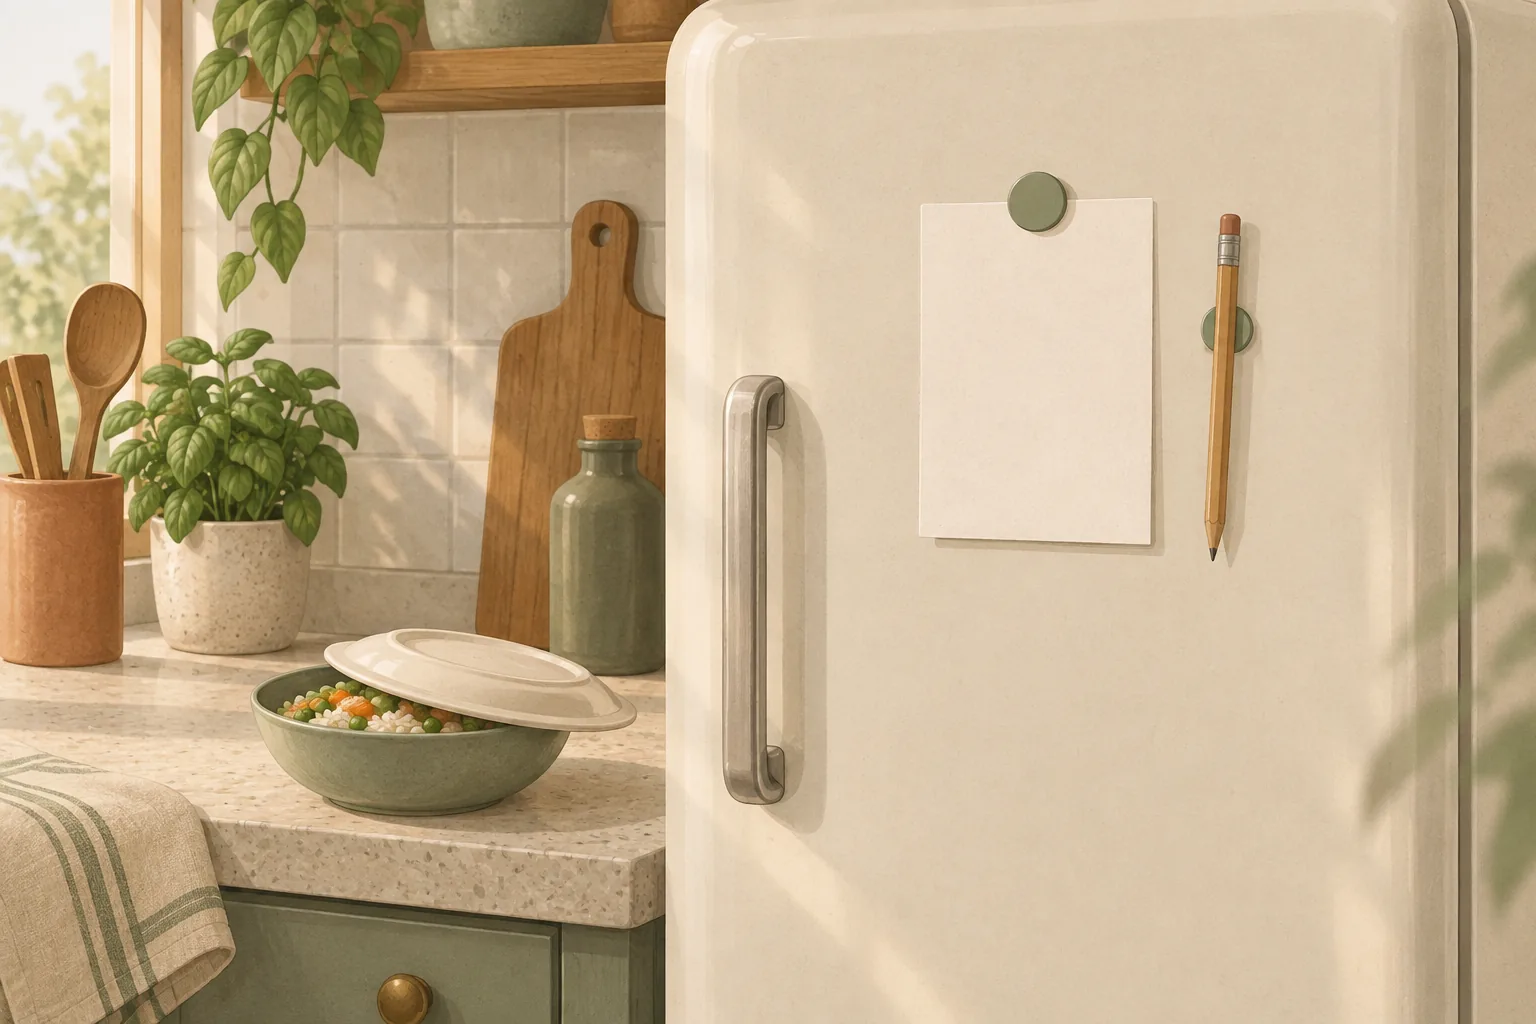
Keep a note on the fridge for two to four weeks. Every time food goes in the trash, write what it was and roughly what it cost, from the receipt rather than memory. Divide the total by what you spent on groceries over the same weeks. That share, applied to a year, is your food waste bill.
Most households find the same few categories every time: salad leaves, bread, leftovers and whatever came in a big pack because the unit price looked better. That last one has its own arithmetic, which we work through in is buying in bulk cheaper. Storing produce in the right place helps with the first of those; how to store produce has UC Davis's chart. Once you know which category is yours, how to reduce food waste at home ranks the habits by the cause they fix.
Duneed, our iPhone app, reads the prices from grocery receipts, and its Premium plan counts what was thrown away and what it cost, which replaces the fridge note for anyone who scans their receipts anyway.
Common questions
What percentage of food is wasted in the US?
ReFED estimates 29% of the US food supply went unsold or uneaten in 2024, with 25% going to waste destinations such as landfill. The often-quoted 30 to 40% traces back to a USDA estimate of 31% based on 2010 data.
How much food does the average American waste?
EPA puts it at 256 pounds of edible food per person per year, for 2019 to 2023, or 349 pounds per person in 2019 once inedible parts and every disposal route are counted.
How much money does the average family lose to food waste?
EPA's 2025 estimate is $728 per person a year, or $2,913 for a household of four, about 11% of total food spending.
Where does most food waste happen?
In 2019, households and food service each produced 40% of the wasted food EPA counted in retail, restaurants and homes, and food retail produced 20%. Manufacturing adds another 40.1 million tons on top.
What is the latest year of food waste data?
For the US, 2024 (ReFED) and 2019 (EPA, the latest national government figure). Globally, 2022 for food waste (UNEP) and 2023 for food loss (FAO).
Sources
- ReFED refed.org
- EPA 2019 Wasted Food Report epa.gov
- EPA 2030 goal epa.gov
- EPA cost of food waste report epa.gov
- USDA ERS ers.usda.gov
- FDA fda.gov
- UNEP Food Waste Index 2024 unep.org
- FAO fao.org
- changed its method in 2018 epa.gov
- Conrad et al., PLOS ONE journals.plos.org
- 2011 FAO estimate fao.org
Found a mistake? Tell us and we will correct it: support@duneed.app