
Grocery price book: a free printable and how to fill it from receipts
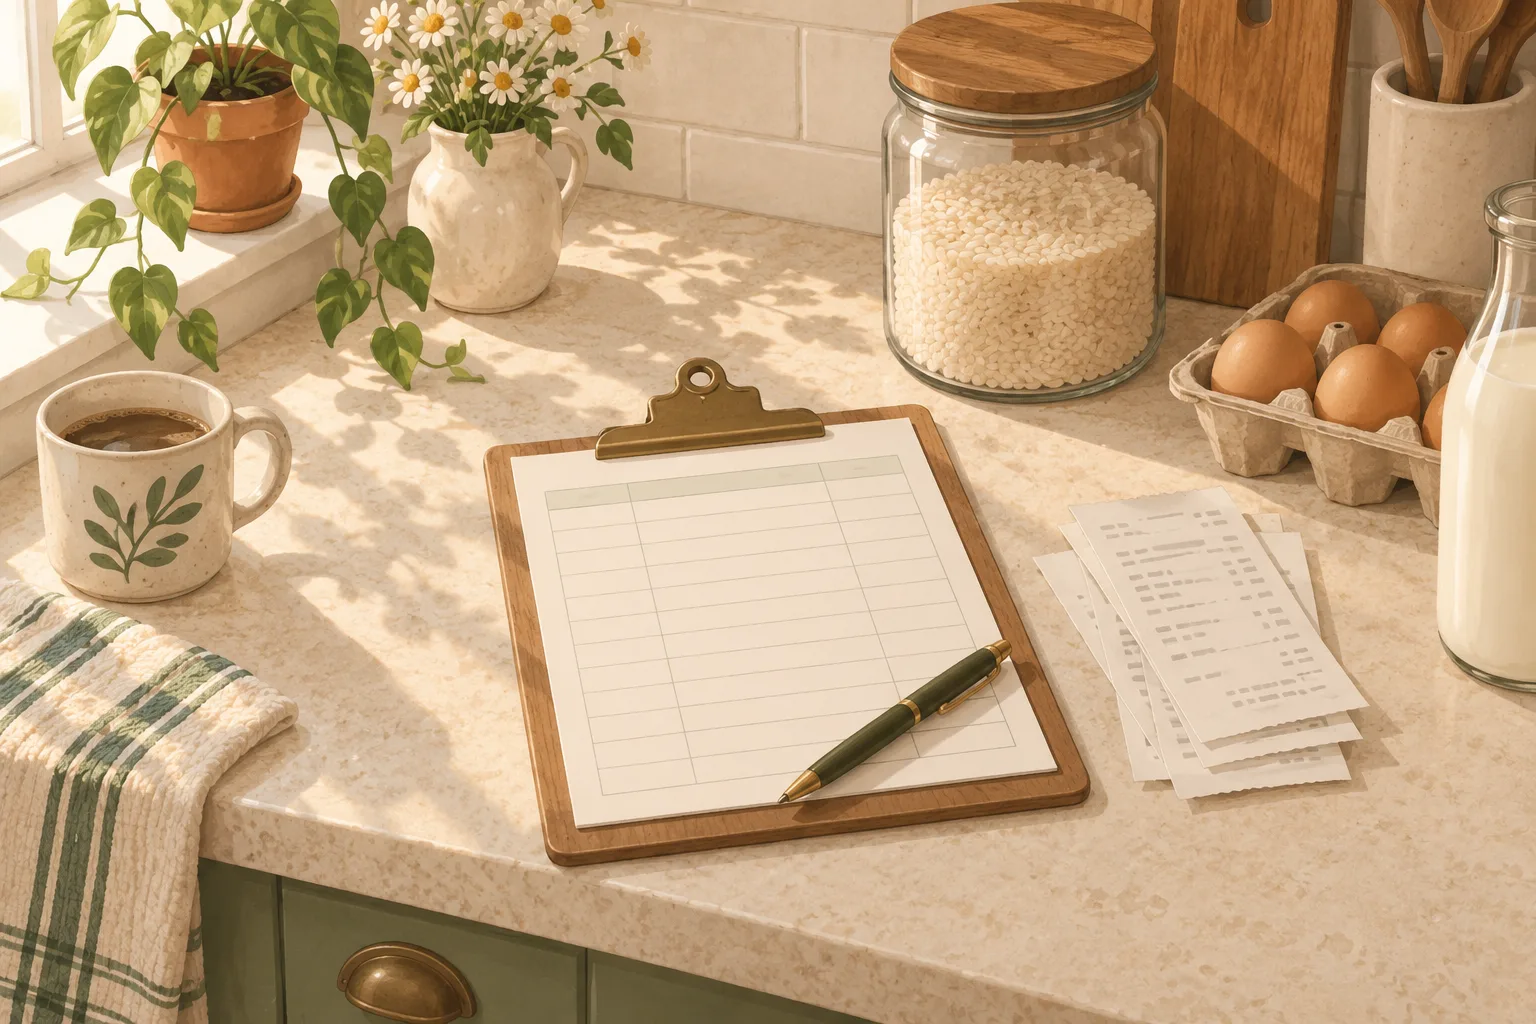
A grocery price book is one page that records what you actually paid for the things you buy most, so the next time a sign says "sale" you know whether it is one. Write the item, the store, the size, the price and the price per unit. After three or four shops the page tells you your own buy price for each item, which is the only benchmark that matters.
The printable below is the paper version. The rest of this page is how to fill it without turning your kitchen into a research project: which items to include, where the numbers come from, and how to read the page once it has data in it.
Download the free grocery price book
- Grocery price book, US Letter (PDF)
- Grocery price book, A4 (PDF)
- Grocery price book (CSV, for Excel, Numbers or Google Sheets)
One page, 25 lines, grouped into produce, meat and eggs, dairy, pantry, frozen and household. The columns are item, store, brand or pack, size, price, unit price and date. Print several copies and keep them in a folder, or open the CSV and sort by unit price once you have a few weeks in it.
What a price book actually answers
A budget tells you how much to spend in a month. Our grocery budget calculator does that from the USDA food plans. A price book answers a smaller question, at the shelf, in about two seconds: is this a price I should buy at, or will it be cheaper in a fortnight? A grocery budget template keeps the month on track once you have the number.
That question is hard to answer from memory for a reason. You see a price roughly once a week, alongside forty other prices, and the number you remember tends to be the one from a sale. Written down, the same prices turn into a range with a floor, and the floor is what you compare against.
It also settles arguments that feel like beliefs. Whether the big pack is cheaper. Whether the store brand is really 30% less. Whether the shop across town is worth the drive, or is only cheaper on four things you rarely buy.
Fill it from receipts, not from memory
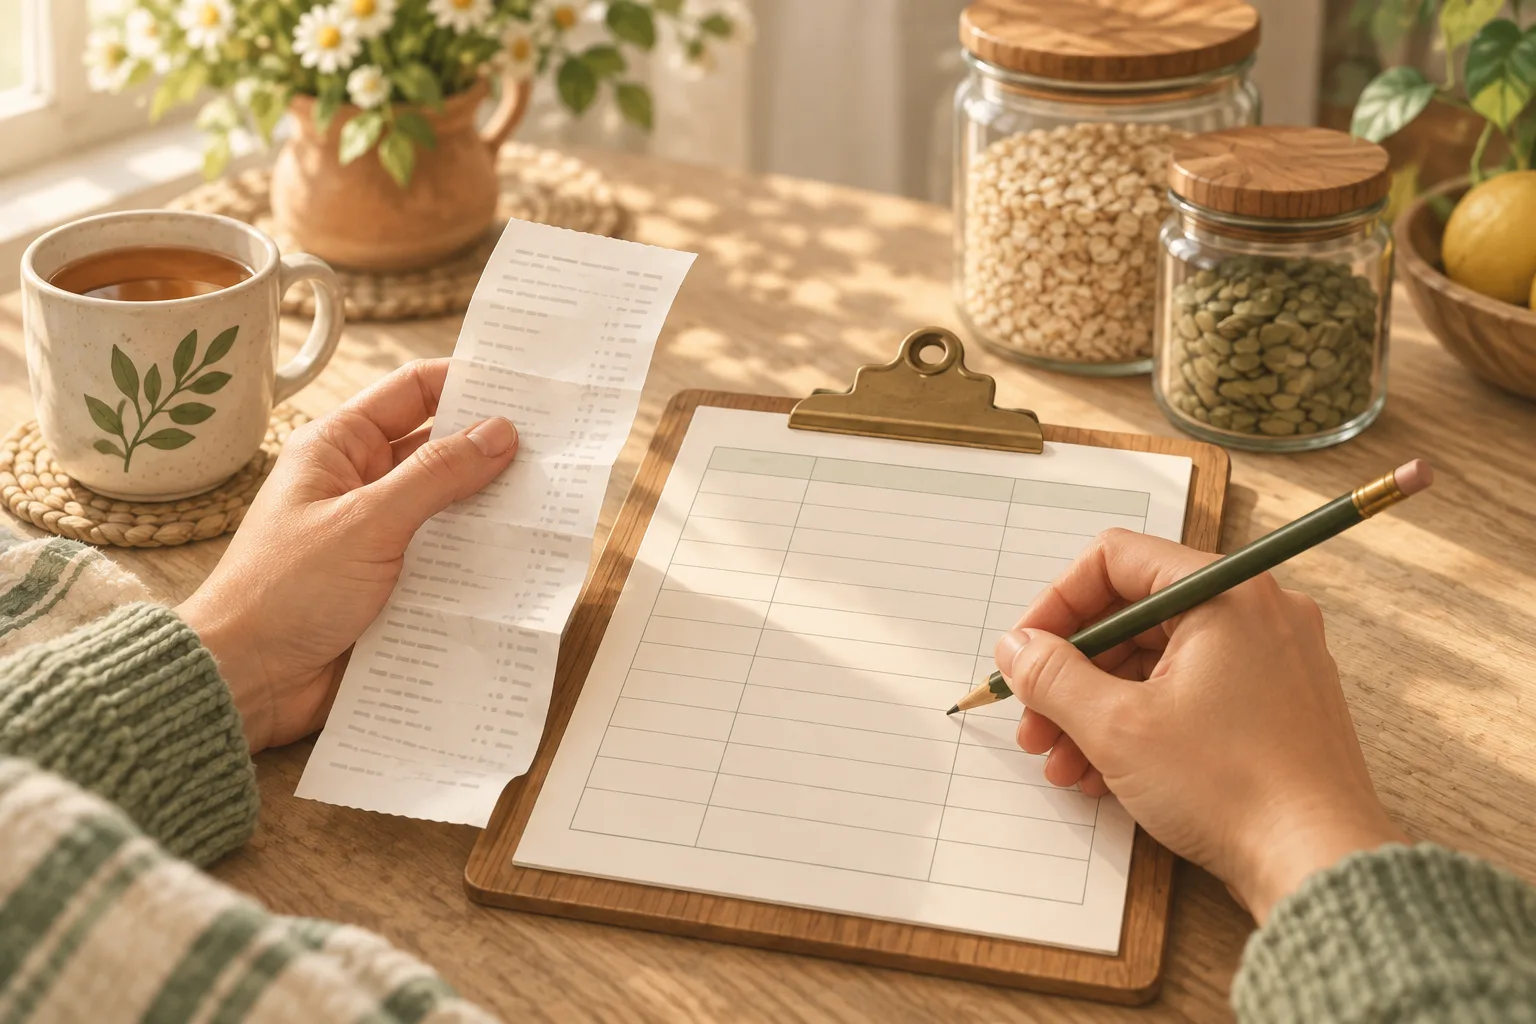
The fastest way to start is with receipts you already have, because the price is printed on them and so is the date.
- Take the last two or three receipts. Ignore anything you bought once.
- For each item you buy regularly, copy the item, the store, the price and the date onto a line.
- Add the size from the pack itself or from the shelf next time. Receipts often abbreviate the item and leave the size off, which is the one gap you have to fill by hand. If the abbreviations are unreadable, our guide to grocery receipt codes explains what the letters and numbers mean.
- Work out the unit price and write it in the last column.
After that, the book grows by about five lines a shop, which takes a minute while you unpack. You do not have to buy something to record its price: writing down what the shelf says for a brand you skipped is often more useful than recording what you bought.
Which items to track
Twenty items is plenty, and the right twenty are the ones that carry your bill rather than the ones with the biggest percentage swings.
Pick them like this: take a month of receipts, add up what you spent per item, and take everything that got more than about 2% of the total. For most households that is milk, eggs, bread, coffee, chicken, mince, cheese, a cooking oil, rice or pasta, a cereal, bananas, a couple of vegetables you buy weekly, laundry detergent and paper towels. Our list of pantry staples is a reasonable starting set if you would rather not add up receipts first.
Leave out anything you buy twice a year. A price book for spices is a hobby, not a saving.
The unit price column is the one that decides
Shelf price tells you what leaves your wallet. Unit price tells you what you are paying for the stuff inside, and it is the only fair way to compare a 16 oz jar with a 24 oz jar, or a store brand with a name brand.
unit price = price ÷ size
A 16 oz jar at $3.49 is $0.218 an ounce. A 24 oz jar at $4.79 is $0.200 an ounce, so the bigger jar is about 9% cheaper per ounce even though it costs $1.30 more at the till. Our unit price calculator does this for up to six products at once, including multipacks and mixed units, and you can copy the answer straight into the column.
Two practical notes. Keep one unit per item for the whole page: if you start milk in dollars per quart, do not switch to dollars per liter three lines later. And watch what the store's own tag is doing. In the US there is no federal law requiring unit prices at all: NIST's guide to state pricing laws lists the states that make them mandatory, the ones where they are voluntary, and the majority with no rule. Where a store does show them, the model regulation in NIST Handbook 130 says every size of the same product should use the same unit, and it lets the store round a unit price under a dollar either to the whole cent or to a tenth of a cent. Two products that read $0.22 on the tag can be a real 4% apart.
What counts as a good price for you
Once an item has four or five entries, three numbers fall out of the page:
- Your floor. The lowest unit price you have actually seen. This is the price to buy at, and the one worth stocking up on.
- Your usual. What you pay most weeks. Anything at or below this is fine.
- Your ceiling. The worst price you have paid, usually at the convenience shop or on a Sunday. Seeing it written down is what stops it repeating.
Write your floor at the top of each item's block in pencil. Then the decision at the shelf is a comparison, not a memory test.
You will also see cycles. Frugal blogs often repeat that supermarket items go on sale every 12 weeks or so; whether that holds for your shops is exactly the kind of claim your own page can check, and it varies by category and by chain. Track the dates for two or three months and you will know your cycle rather than someone else's.
How much to buy when you hit your floor
A floor price is only worth something if you buy enough to reach the next one. The amount is your weekly use multiplied by the length of the cycle, and the cycle is the number your own dated lines give you.
Coffee, say. You get through a 12 oz bag every two weeks, and your page shows the low price coming round about every six weeks. Six weeks of use is three bags, so that is the number to buy at the floor, not one bag and not eight.
Two limits cut that number down:
- How long it keeps. Ground coffee at three months is fine. Bread at three weeks is not, unless it goes in the freezer, in which case our freezer inventory sheet is how you find it again.
- Where it goes. A stockpile you cannot see gets bought twice. Whatever you stock up on should land on a pantry inventory list, or it turns into the third jar of cumin.
- What you throw away. A floor price you reach by buying three bags is no saving if the third bag goes stale. The break-even math for buying in bulk is the same comparison in percentages.
Items sold by weight
Meat, fish and loose produce need one extra step, because the pack price is meaningless: a $10.32 line is a price for that particular tray, not a price you can compare next week.
Record the per-pound or per-kilogram figure instead. It is printed on the shelf label and it is usually on the receipt too, on the line under the item, as weight and rate. Our guide to grocery receipt codes has what those weight lines look like at the major chains.
For loose produce, write the PLU or the description as well, because "apples" covers a $1.29 and a $3.49 pound in the same shop.
When a second store is worth the trip
The page answers this one properly, which is rare, because it has your prices at both places rather than a general claim that one chain is cheaper.
Take your ten biggest items, write each store's floor beside them, and multiply the difference by how many you buy in a month. If the second store's total is $18 a month better, that is your number; weigh it against the fuel and the 40 minutes. A split shop, where staples come from the cheaper store once a month and fresh food from the nearer one weekly, usually beats both loyalties.
What makes this convincing is that the difference is almost never where people assume. It tends to sit in three or four items with large gaps, and vanish across the rest.
What six weeks of one item looks like
One line a shop, on the same item, in the same unit:
| Date | Store | Size | Price | Unit price |
|---|---|---|---|---|
| 8 Aug | Store A | 12 oz | $8.49 | $0.708 / oz |
| 15 Aug | Store A | 12 oz | $8.49 | $0.708 / oz |
| 22 Aug | Store B | 32 oz | $17.99 | $0.562 / oz |
| 29 Aug | Store A | 12 oz | $6.99 | $0.583 / oz |
| 5 Sep | Store A | 12 oz | $8.49 | $0.708 / oz |
| 12 Sep | Store B | 32 oz | $15.49 | $0.484 / oz |
Six lines, and the item now has a floor of $0.484 an ounce, a usual of about $0.71, and a visible pattern: the big bag at Store B beats every small bag at Store A, even at full price. Before the page existed, the $6.99 sale on 29 August looked like the good deal of the month. It was 20% worse than the bag that was not on sale.
How often to update it
Prices move slowly enough that a weekly line per item is more than enough, and quickly enough that a book left alone for a year is fiction. Food at home rose 2.2% in the 12 months to August 2026 (BLS), and USDA's Economic Research Service forecasts a 2.5% rise for 2026, with a range of 1.7% to 3.3%. That is the background drift. Individual items do far more: eggs and coffee can move by a quarter in a season while flour sits still. Grocery prices 2026 lists the national average for 14 staples a year apart, a useful check on your own book.
A routine that survives contact with a normal week:
- Every shop: add the five lines for what you bought. One minute, while unpacking.
- Every month: update the floor for each item, and cross out any brand you have stopped buying.
- Twice a year: walk one aisle of a store you do not normally use and copy ten shelf prices. That is how you find out whether the other shop is actually cheaper, which is the only way to answer a question you cannot answer from your own receipts.
Paper, spreadsheet or app
Paper wins on speed at the shelf and loses on sorting. The printable is one page in a folder; you can see six weeks of a single item at a glance and you never open an app in an aisle.
A spreadsheet wins the moment you want to sort by unit price or chart an item over a year. Open the CSV above, keep one row per observation and let a pivot table do the rest. Our guide to tracking grocery spending has the spreadsheet version of the wider job, which is where the totals live.
An app wins if the typing is what stops you. That is the honest trade: the price book fails from data entry, not from arithmetic. Duneed, our iPhone app, reads each receipt's lines with the price paid and keeps them by month and category, so the prices are already written down when you sit down to update the page.
A worked example: one week of receipts
Two receipts from the same week, six lines in the book:
| Item | Store | Size | Price | Unit price | Date |
|---|---|---|---|---|---|
| Whole milk | Store A | 1 gal | $3.99 | $0.031 / fl oz | 12 Sep |
| Large eggs | Store A | 12 | $3.49 | $0.29 each | 12 Sep |
| Chicken breast | Store B | 2.4 lb | $10.32 | $4.30 / lb | 14 Sep |
| Rice | Store B | 5 lb | $6.99 | $0.087 / oz | 14 Sep |
| Coffee | Store A | 12 oz | $8.49 | $0.708 / oz | 12 Sep |
| Paper towels | Store B | 6 rolls | $9.49 | $1.58 / roll | 14 Sep |
Nothing about that week looks remarkable. Three weeks later, though, the same page says chicken has been between $2.99 and $4.30 a pound, coffee has never been under $0.70 an ounce at Store A, and rice at Store B has not moved at all. The first fact changes what you cook when chicken is at $2.99. The second tells you to check the other shop for coffee. The third means you can stop checking rice.
Where price books fail
- Too many items. Forty lines a week gets abandoned in a fortnight. Twenty items, five lines a shop.
- No size column. A price with no size is a number you cannot compare. If the receipt does not say, get it off the pack.
- Mixed units. Dollars per pound on one line and per kilogram on the next makes the column useless.
- Chasing a low unit price into the bin. The cheap big pack only saves money if you eat it. EPA puts the cost of food a US consumer pays for and never eats at $728 a year, so a pack that goes off is a bigger loss than the few cents saved per ounce. Our food waste calculator puts a number on that side of it.
- Recording only what you bought. Half the value is in the prices you did not pay: the brand you skipped, the shop you visited once.
Questions
Does a grocery price book really save money?
It saves by changing two decisions: which size you buy and when you stock up. The size question is usually worth a few percent on every shop, and the stock-up question turns the floor price into your normal price for items that keep. Neither is dramatic on one trip, and both compound over a year.
How many items should be in a price book?
About 20 to start, which covers most of a typical bill. Add an item when you notice you cannot remember what it usually costs, and drop one when you stop buying it.
How do I compare a sale price with a loyalty or member price?
Record the price you actually paid, and note the type in the brand column: sale, member, coupon. A floor that only exists with a coupon you no longer have is not your floor.
What about price matching?
If your store matches competitors, the price book is the evidence. A dated line with the store, the size and the price is what a match usually needs, and it also tells you whether the trip is worth it at all.
Is this the same as tracking grocery spending?
No. Tracking spending answers how much a month costs and where it goes; see how to track grocery spending for that. The price book answers what one item should cost, which is the question you have at the shelf. They work well together: the receipts you use for one fill the other.
Sources
- guide to state pricing laws nist.gov
- NIST Handbook 130 nist.gov
- BLS bls.gov
- a 2.5% rise for 2026 ers.usda.gov
- $728 a year epa.gov
Found a mistake? Tell us and we will correct it: support@duneed.app