
How much should I spend on groceries? USDA numbers for 2026 by household size
Using USDA's July 2026 food plans, an adult aged 20 to 50 living alone comes to about $305 to $585 a month, and the reference family of four about $1,025 to $1,683. These are U.S. food-at-home benchmarks with household-size adjustments, not a required spending target. Restaurant meals and non-food purchases are separate.
Calculate your household's weekly and monthly grocery budget using everyone's actual age. The tables below cover common combinations; your own mix of adults and children can give a different result.
The figures come from USDA's July 2026 reports, issued in August. The source month is shown beside each table so you can distinguish the price period from the date you read the page.
Grocery budget by household size (monthly, July 2026)
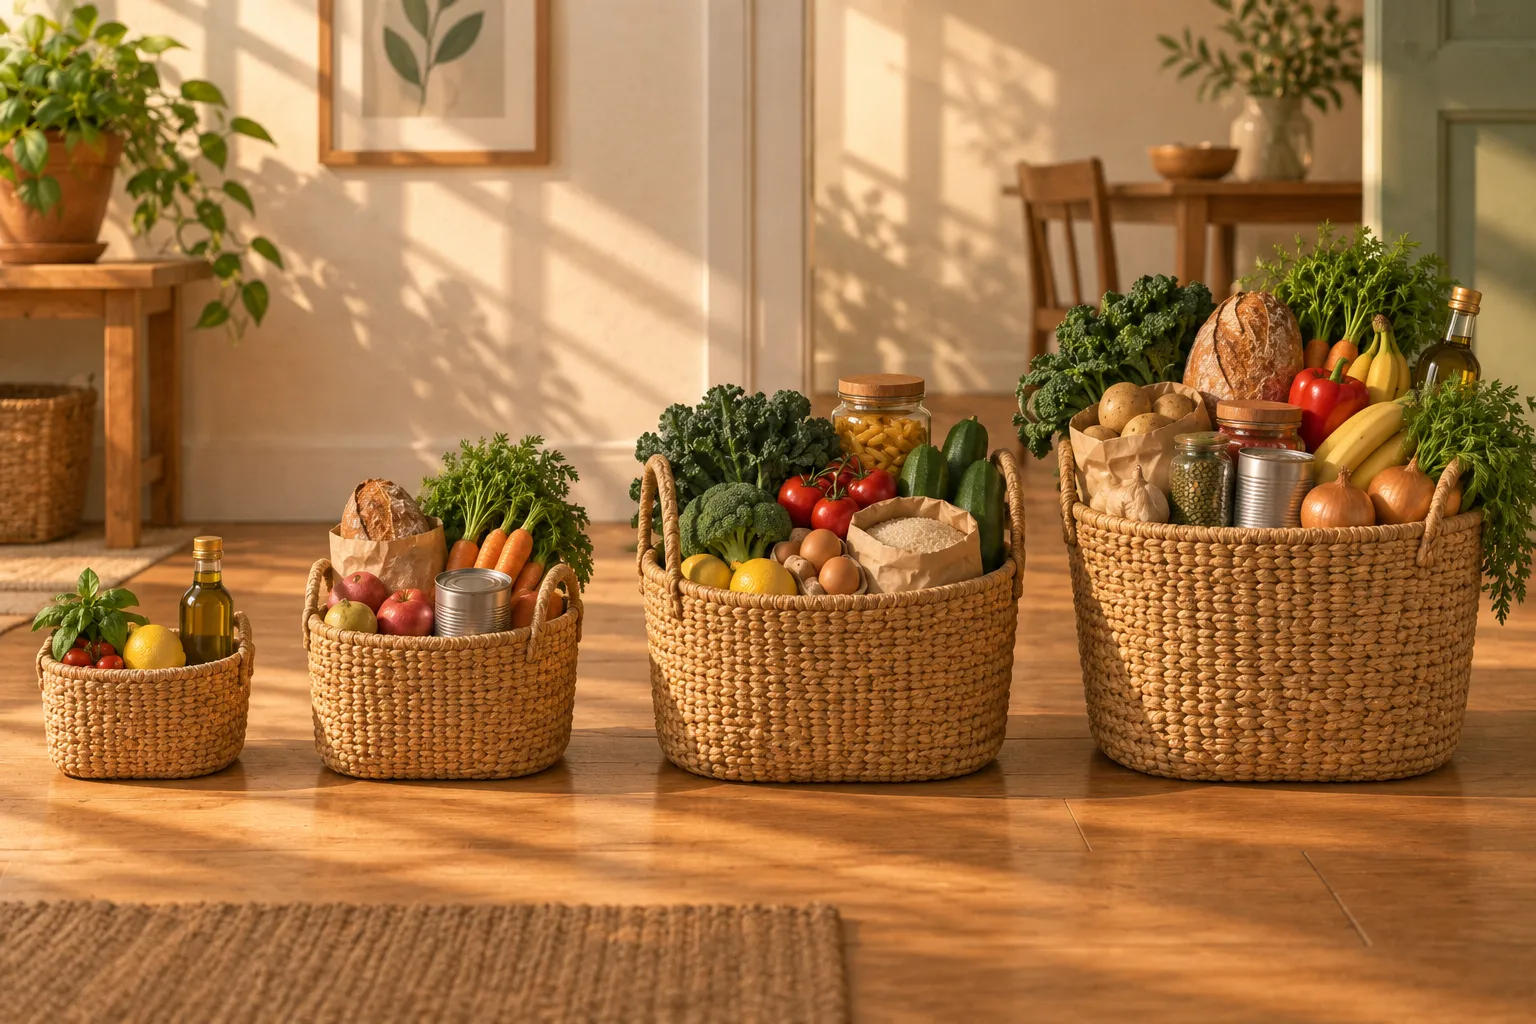
These are household totals with USDA's size adjustment applied. Pick the row closest to your household, then the column that matches how you shop.
| Household | Thrifty | Low-Cost | Moderate-Cost | Liberal |
|---|---|---|---|---|
| 1 woman, 20 to 50 | $305 | $331 | $405 | $516 |
| 1 man, 20 to 50 | $383 | $381 | $478 | $585 |
| 1 woman, 51 to 70 | $284 | $323 | $398 | $480 |
| 1 man, 51 to 70 | $338 | $359 | $450 | $539 |
| Couple, 20 to 50 | $630 | $653 | $809 | $1,009 |
| Couple, 51 to 70 | $570 | $625 | $777 | $934 |
| Couple (20 to 50) + child aged 2 to 3 | $783 | $806 | $990 | $1,229 |
| Couple (20 to 50) + child aged 6 to 8 | $822 | $899 | $1,093 | $1,338 |
| Family of 4: couple + children 6 to 8 and 9 to 11 (USDA reference family) | $1,025 | $1,128 | $1,391 | $1,683 |
| Family of 4: couple + a boy and a girl aged 14 to 18 | $1,160 | $1,187 | $1,464 | $1,793 |
| Family of 5: reference family + child aged 2 to 3 | $1,138 | $1,237 | $1,519 | $1,839 |
| Family of 5: reference family + boy aged 14 to 18 | $1,284 | $1,378 | $1,705 | $2,050 |
Sources: USDA Thrifty Food Plan, July 2026 and USDA Low-Cost, Moderate-Cost and Liberal Food Plans, July 2026. We added up each person's monthly cost, applied the adjustment for household size and rounded to the dollar. Adult examples use ages 20 to 50, where all four plans overlap. The other three plans also include 19-year-olds in their adult band; Thrifty places them in its 14 to 19 band. Enter age 19 in the calculator for that case. Couple examples use one woman and one man; the calculator accepts your own household composition.
Weekly grocery budget by household size
Same households, same plans, per week. Multiply by 4.333 to get back to a month; that's the multiplier USDA itself uses.
| Household | Thrifty | Low-Cost | Moderate-Cost | Liberal |
|---|---|---|---|---|
| 1 woman, 20 to 50 | $70 | $76 | $93 | $119 |
| 1 man, 20 to 50 | $88 | $88 | $110 | $135 |
| 1 woman, 51 to 70 | $66 | $75 | $92 | $111 |
| 1 man, 51 to 70 | $78 | $83 | $104 | $124 |
| Couple, 20 to 50 | $146 | $151 | $187 | $233 |
| Couple, 51 to 70 | $131 | $144 | $179 | $216 |
| Couple + child aged 2 to 3 | $181 | $186 | $229 | $284 |
| Couple + child aged 6 to 8 | $190 | $208 | $252 | $309 |
| USDA reference family of 4 | $237 | $260 | $321 | $388 |
| Couple + two teens aged 14 to 18 | $268 | $274 | $338 | $414 |
| Reference family + child aged 2 to 3 | $263 | $285 | $350 | $424 |
| Reference family + boy aged 14 to 18 | $296 | $318 | $393 | $473 |
What the four USDA food plans assume
All four plans describe a nutritious diet. What changes between them, in USDA's words, is the specific foods and the quantities of each. Both reports state the same key assumption in their footnotes: every meal and snack is prepared at home. Our food per week calculator shows the Thrifty plan's quantities, in pounds by food group, for your household.
That assumption matters more than anything else on this page. The plans include no takeout, no work lunches, no school cafeteria and no coffee shop. They also cover food only, so dish soap, paper towels and cat litter on the same receipt don't count against these numbers. And they're U.S. average prices, not prices in your town.
A detail most grocery budget articles miss: the Thrifty plan and the other three aren't built on the same foundation. The Thrifty Food Plan was reevaluated in 2021 and rests on 2013 to 2016 consumption data and the 2020 to 2025 Dietary Guidelines. The Low-Cost, Moderate-Cost and Liberal plans are still based on 2001 to 2002 data and the 2005 guidelines, updated for inflation with the Consumer Price Index. USDA's own footnote says the 2021 Thrifty update "begins the process" of revising the other three.
The side effect shows up in the tables. For men aged 20 to 50, the unadjusted Thrifty cost is $319.20 a month and Low-Cost is $317.40. Boys aged 14 to 18 and children aged 4 to 5 have the same inversion. So don't read the four plans as a clean ladder. For adult men, Thrifty and Low-Cost are effectively one budget, and the real step up is to Moderate-Cost.
The Thrifty plan has one more job: its reference family of four is the figure used to set the maximum SNAP allotment, according to the report.
USDA food costs by age and sex (per person)
These are the raw per-person numbers from the July 2026 reports, weekly / monthly. USDA calculates them for someone living in a four-person household, so if your household is a different size, they need the adjustment in the next section.
| Person | Thrifty | Low-Cost | Moderate-Cost | Liberal |
|---|---|---|---|---|
| Child, 2 to 3 | $39.90 / $172.90 | $40.10 / $173.80 | $47.90 / $207.40 | $58.30 / $252.60 |
| Child, 6 to 8 | $48.40 / $209.60 | $60.70 / $262.80 | $70.40 / $305.10 | $82.40 / $357.00 |
| Child, 9 to 11 | $55.90 / $242.20 | $62.70 / $271.60 | $80.80 / $350.20 | $94.20 / $408.20 |
| Girl, 14 to 18 | $60.10 / $260.50 | $62.60 / $271.10 | $74.90 / $324.60 | $92.40 / $400.60 |
| Boy, 14 to 18 | $75.40 / $326.70 | $74.30 / $322.10 | $93.20 / $403.70 | $109.60 / $474.70 |
| Woman, 20 to 50 | $58.60 / $253.90 | $63.70 / $276.10 | $77.80 / $337.10 | $99.30 / $430.20 |
| Man, 20 to 50 | $73.70 / $319.20 | $73.30 / $317.40 | $92.00 / $398.70 | $112.50 / $487.50 |
| Woman, 51 to 70 | $54.60 / $236.50 | $62.10 / $269.00 | $76.50 / $331.40 | $92.30 / $399.70 |
| Man, 51 to 70 | $64.90 / $281.40 | $69.10 / $299.50 | $86.60 / $375.00 | $103.70 / $449.30 |
| Woman, 71+ | $60.20 / $260.90 | $62.00 / $268.80 | $76.30 / $330.80 | $91.20 / $395.40 |
| Man, 71+ | $62.00 / $268.50 | $68.50 / $296.90 | $84.20 / $364.70 | $103.60 / $449.00 |
Thrifty age bands are 14 to 19 and 20 to 50; the other plans use 14 to 18 and 19 to 50. The adult rows above show the shared 20 to 50 range, and the teen rows show ages 14 to 18. The full reports also list 1-year-olds, 4 to 5, 12 to 13 and the other groups.
Kids get more expensive in steps. On the Low-Cost plan a boy moving from the 9 to 11 band into 12 to 13 goes from $271.60 to $316.80 a month, a $45 jump on one birthday before prices change at all.
How USDA adjusts for household size
The per-person costs assume a four-person household. For any other size, the report footnotes give these corrections:
| Household size | Adjustment |
|---|---|
| 1 person | add 20% |
| 2 people | add 10% |
| 3 people | add 5% |
| 4 people | none |
| 5 or 6 people | subtract 5% |
| 7 or more people | subtract 10% |
In plain terms, a person living alone costs more to feed per head than the same person in a family, and a big household costs less per head. Grocery budget for one person has every adult age band with the adjustment already applied. Check this before trusting a single-person figure you find online: some sites quote the raw per-person cost and skip the extra 20%. Couples get the same treatment with 10%; our grocery budget for 2 people works it through for every age band and for same-sex couples.
To work out your own number (a grocery budget calculator on paper):
- Find each person's monthly cost in the table above, on the plan you want.
- Add them together.
- Multiply by the adjustment for your household size: 1.20, 1.10, 1.05, 1.00, 0.95 or 0.90.
Or enter everyone's age in our grocery budget calculator, which does the adding and the adjustment for all four plans at once.
Worked example: a couple in their 30s with a 7-year-old
You're 30, your partner is 31, your daughter is 7, and you want to shop at the Low-Cost level.
- Monthly Low-Cost costs: man 20 to 50 is $317.40, woman 20 to 50 is $276.10, child 6 to 8 is $262.80.
- Add them: $317.40 + $276.10 + $262.80 = $856.30.
- Three people, so add 5%: $856.30 × 1.05 = $899.12.
That's about $899 a month. Weekly it's ($73.30 + $63.70 + $60.70) × 1.05 = $207.59, and over a year $899.12 × 12 = $10,789.
The same family on the Moderate-Cost plan: ($398.70 + $337.10 + $305.10) × 1.05 = $1,092.95 a month. The gap between the two plans is about $194 a month for this household.
What households actually spend on groceries
The USDA plans say what a healthy diet costs if you cook everything. The Bureau of Labor Statistics' Consumer Expenditure Survey says what households really spend. The latest release, published December 2025, covers 2024: the average household spent $6,224 a year on food at home, which is $519 a month. The detailed tables break that down by household size:
| Household size | Average people | Food at home per year (2024) | Per month |
|---|---|---|---|
| 1 person | 1.0 | $3,395 | $283 |
| 2 people | 2.0 | $6,088 | $507 |
| 3 people | 3.0 | $7,597 | $633 |
| 4 people | 4.0 | $8,697 | $725 |
| 5 or more | 5.7 | $10,274 | $856 |
| All households | 2.4 | $6,224 | $519 |
Every row sits below even the Thrifty plan. A typical four-person household spent $725 a month at the grocery store, roughly 29% under the $1,025 Thrifty figure for the reference family. A large part of the gap is the at-home assumption. The same four-person households spent another $5,847 a year ($487 a month) on food away from home, and across all households, food away from home was 39% of total food spending.
These figures measure different things: observed grocery spending in 2024 and a July 2026 food plan that assumes all meals are prepared at home. The gap alone cannot tell you how much of the difference comes from eating out. If you're comparing yourself to these averages, compare total food spending, not just groceries. Grocery budget for a family of 4 works through the July 2026 plans for families with toddlers, school-age children and teenagers.
Two caveats. These are 2024 dollars, and prices have kept moving: the Consumer Price Index for food at home rose 2.2% over the 12 months ending August 2026, and USDA's Economic Research Service forecasts a 2.5% increase for 2026. And the survey records what people spent, not what a sensible budget would be. Grocery prices 2026 has this year's changes by aisle and item. To see what any past grocery bill would cost today, try our grocery inflation calculator.
Grocery costs by region
USDA's monthly plans are national averages with no regional version. The BLS survey does split spending by region, and the gap is wide:
| Region | Food at home per year (2024) | Per month |
|---|---|---|
| Northeast | $7,165 | $597 |
| West | $7,112 | $593 |
| Midwest | $5,846 | $487 |
| South | $5,502 | $459 |
A Northeast household spent about 30% more on groceries than a Southern one. Read this as spending, not a price index: incomes differ by region too (average pre-tax income was $115,770 in the Northeast and $93,814 in the South), and Western households were slightly larger at 2.6 people against 2.4 elsewhere. Even so, if you live somewhere expensive, it's reasonable to budget one plan level above the one your diet alone would suggest.
How to set your own grocery budget

The tables give you a reference point. They can't tell you where you actually are, and guessing is unreliable, because the small trips (milk and bread on the way home, a second run for the thing you forgot) never make it into anyone's mental total.
The method we'd use:
- Keep every grocery receipt for 4 to 8 weeks. Four is the minimum, since a single stock-up trip can double one week. If you do a warehouse-club run once a month, go for eight.
- Strip out what isn't food: detergent, trash bags, pet food, pharmacy items. Otherwise you're comparing your receipts against a food-only benchmark.
- Total each week, average the weeks and multiply by 4.333 for a monthly figure.
- Find your household in the table above and see which plan your real number is closest to.
- Set your budget at that level, or one level down if you want to cut. We wouldn't try to drop two levels in one go (Liberal straight to Thrifty); that means changing what you eat, and a tighter version of your current diet is much easier to hold. Our free grocery budget template keeps the month against that number, receipt by receipt.
The step people give up on is the first one, typing line after line into a spreadsheet. Our guide to tracking grocery spending compares five ways to do it, including how to split food from non-food on a mixed receipt, and if receipt abbreviations stop you from telling the dish soap from the cheese, see what the codes on a grocery receipt mean. Duneed, our iPhone app, reads a photo of each receipt, sorts the lines into categories with the prices paid and shows the month's total against last month, so the 4 to 8 weeks produce a number without the typing.
Ways to bring the number down
Once you know your real number, these are the changes that move it. For the full list, in rough order of how much each one saves, see how to save money on groceries.
Cook what you already bought. A bag of spinach that goes slimy in the drawer was paid for in full, and it's the cheapest money to recover because it needs no new habits at the store. Writing expiry dates down, even on a fridge list, makes the next few days' meals obvious. Our expiration date tracker has a template.
Check the pantry before you write the list, not after you get home. A simple pantry inventory list makes that check quick. The third jar of cumin and the second bag of frozen peas are how a household spends Moderate money on a Low-Cost diet.
If two or more people shop, use one list. A shared grocery list stops duplicate buys, which quietly add up in families where either parent might stop at the store.
Compare unit prices and try store brands on the staples where you can't taste a difference: flour, canned tomatoes, rice, frozen vegetables. Keep the name brand where you can taste one.
Plan for growth. Children move into more expensive age bands, and a boy aged 14 to 18 costs more to feed than a man aged 20 to 50 on every plan except Liberal. Raising the budget a little each birthday beats a sudden shortfall.
One trade-off to watch: moving takeout meals home makes your grocery bill go up. That's fine. If groceries rise by $150 a month and restaurant spending falls by $300, the household is $150 ahead, and you only see that if you track both. We work out the per-meal version, with the time and the wasted groceries counted, in cooking at home vs eating out.
Frequently asked questions
Is $200 a week enough for a family of four?
It's below USDA's cheapest plan. The reference family of four (two adults, children aged 6 to 8 and 9 to 11) costs $236.50 a week on the Thrifty plan in July 2026, so $200 is about 15% under. With younger children it's closer: a couple with a 2-to-3-year-old and a 4-to-5-year-old comes to $215.70 a week on Thrifty. For comparison, four-person households in the BLS survey spent about $167 a week on groceries in 2024, but they were also buying meals out.
How much should one person spend on groceries a week?
After the 20% single-person adjustment, a woman aged 20 to 50 is looking at about $70 a week on the Thrifty plan and $119 on Liberal. For a man the same age it's about $88 to $135. One-person households in the BLS survey actually spent about $65 a week on food at home in 2024.
What percentage of income goes to groceries?
On average, about 6%. In 2024 the average household spent $6,224 on food at home against $104,207 in pre-tax income, and about 9.8% on all food including eating out. One-person households spent about 6.7% of pre-tax income on groceries and households of five or more about 7.4%. These are averages across all incomes, so treat them as context rather than a rule.
Sources
- USDA Thrifty Food Plan, July 2026 fns-prod.azureedge.us
- USDA Low-Cost, Moderate-Cost and Liberal Food Plans, July 2026 fns-prod.azureedge.us
- latest release bls.gov
- detailed tables bls.gov
- rose 2.2% over the 12 months ending August 2026 bls.gov
- forecasts a 2.5% increase for 2026 ers.usda.gov
Found a mistake? Tell us and we will correct it: support@duneed.app